Proteus - Sample Output from Splash 2 Programs
This Set
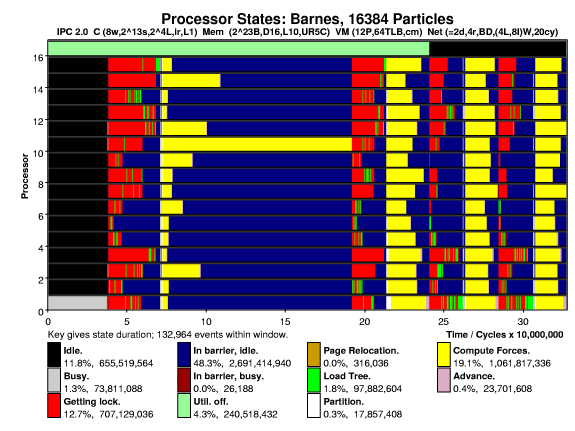
Barnes
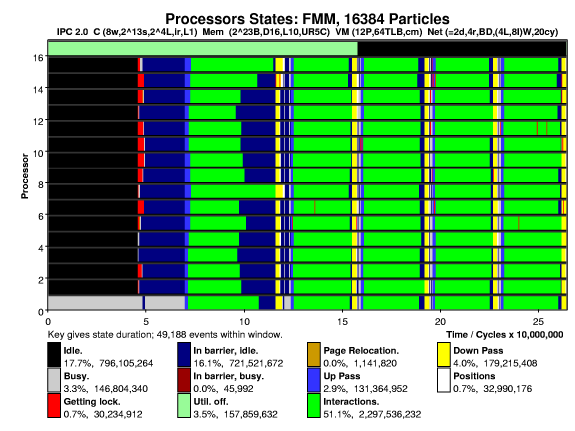
-- FMM
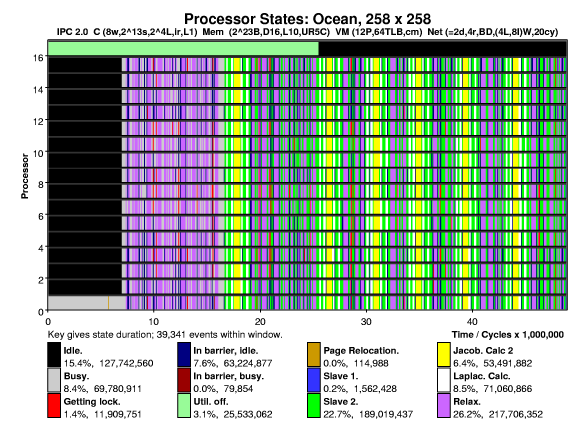
-- Ocean
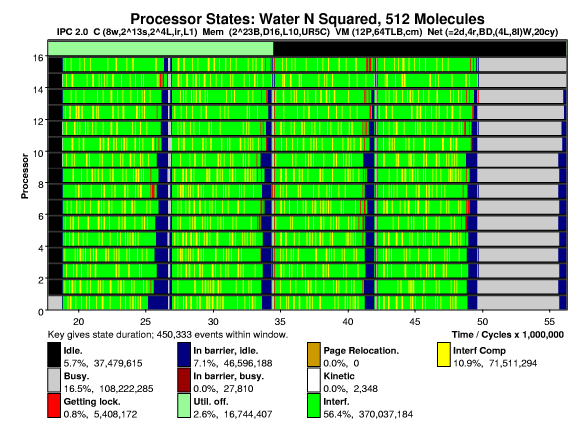
-- Water N2
Other Sets
Set 1: Radix, FFT, LU, Cholesky
Set R: Multiple Radix graphs.
Set 2: Radiosity.
Specifications
The four Splash 2 programs below were run on the following simulated computer:
- 16 Processors interconnected with a 4 × 4 mesh.
- 4-byte link width, 20-cycle node-to-node latency (plus waiting).
- 8-way, 8192-set, physically mapped set-associative cache.
- 1-cycle cache hit latency, 10 cycle memory-access latency.
- Full-map, directory-based coherence protocol.
- 5-entry memory access completion buffer, loads ooowrt stores.
- 4096-byte VM page size, color-matching page assignment.
- 64-entry fully associative TLB.
- 2 instr. / cycle issue rate (not including cache and branch stalls).
Legend Description
The plots show processor activity during execution, there are seven states
common to all Proteus (Version 3.11 and 3.12) runs, the other states are
application specific. The states are:
- Idle: No tasks running.
- Busy: Task running, activity unnamed.
- Getting Lock: Executing a P semaphore operation.
- In barrier, idle: Waiting in barrier, no other activity.
- In barrier, busy: In barrier, either executing barrier
code or another thread is executing.
- Util. off.: Program performing initialization or other
activities not appropriate for statistics collection.
- Page Relocation: A VM page is being moved between memory modules.
The reason for the large work imbalance during the first "compute forces" phase
is unknown.