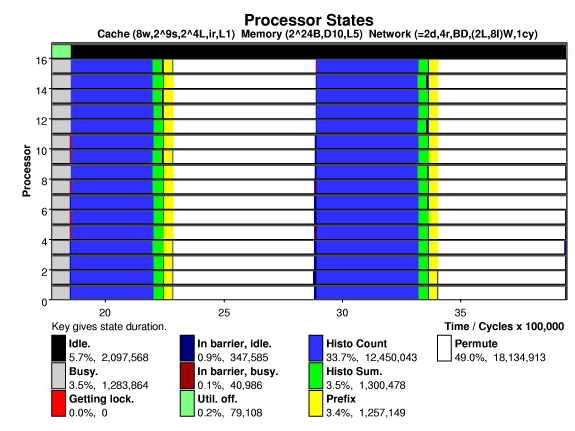
The plot below shows processor states versus time on a 16-processor system running the Splash-2 radix sort on 262144 keys, (the base problem size). Each processor has a small 8-way, 512-set, 16-byte line set associative cache. A directory based cache coherence scheme is used. The system is interconnected by a 2-D mesh, links can transfer two bytes in the time needed to execute an instruction (cycle).
A modified prefix sum algorithm is used, giving better performance on the systems tested. Note the high utilization and that the potentially troublesome global bin sum and parallel prefix operations take only a small fraction of execution time.
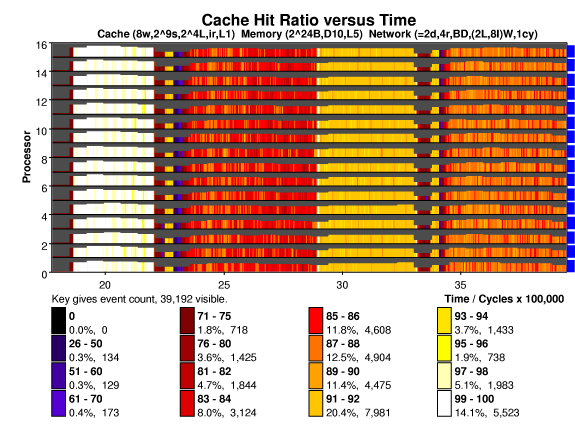
The cache hit ratio for radix is shown below, the states above are clearly visible below. Radix has each processor initialize its own keys, so the first iteration of "histo count" generates few misses. Note the low hit ratio during the histo sum phase. The height of the bars indicate event density, in this case shared memory accesses per unit time. The short bars during histo sum and prefix are due to misses to addresses located at hot spots. These take much longer to service and so there are fewer shared memory accesses per unit time. As expected, the permute state, where keys are written to their new location, suffers a low hit rate. Notice the cache warming at the beginning of permute, when the values computed in the prefix phase are read into the cache. In the second iteration the keys needed in the histo count state are no longer cached, resulting in many more misses.
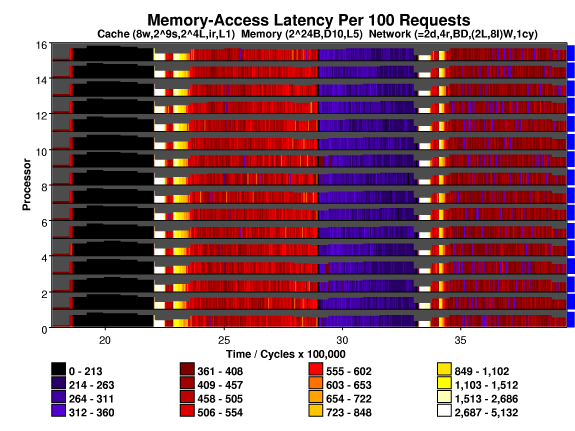
Shared memory access latency is plotted below. Access latency is a function of both hit ratio and time to service a miss. The time to service a miss depends upon the type of access, the location and state of other cached copies, and network congestion.
During the first iteration of histo count the hit rate is very high,
and so access latency is small. Accesses during the histo sum state
are directed to a single memory module and so these suffer hot spot
delays.
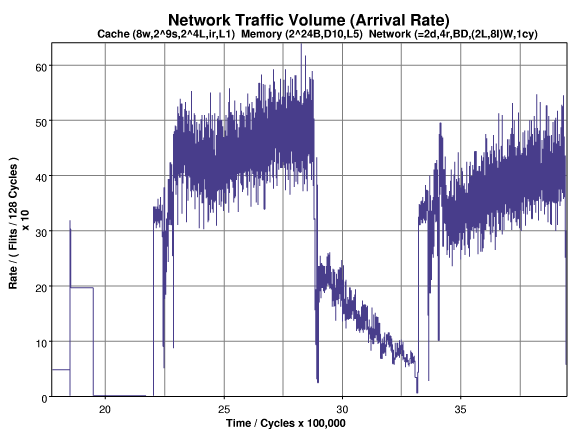
The entry of traffic, including processor-to-memory and memory-to-processor messages, into the network is shown below. As one might expect, the permute phase generates the most traffic. Note that the traffic volume increases during the permute phase and decreases during histo count.
The traffic decreases during the histo count phase because as the phase progresses it becomes increasingly likely that a needed "from key" has been evicted from a second cache, and so a miss to that key will require fewer messages. (In a simulation using a larger cache [not shown] the traffic during this phase is flat.)
The permute phase reads contiguous array elements, writing them to non-contiguous locations. Initially, the destination memory locations are non-cached or in a non-exclusive state, as the phase proceeds it becomes more likely that a destination is cached exclusively elsewhere. (Each 16-byte line holds four keys.) A write miss to a memory location cached exclusively generates more traffic than a write miss to locations in other states, resulting in the trend.
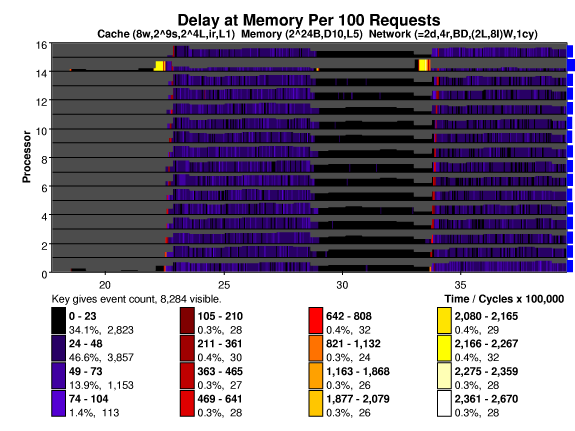
The plot below shows waiting that messages suffer (they're impatient)
when they arrive at a memory. The units are per 100 requests, so the
waiting time in cycles is the key value divided by 100. For the most
part waiting time is zero or small. (Fast memory is simulated.) The
exception is during the histo sum and prefix phases. To compute the
histogram sum all processors, within a very short time, write to
storage located on one memory. The hot spot is apparent on processor
14 at 2.2 million and 3.4 million cycles. The prefix sum sweeps across
the memories but accesses are not as concentrated as during the histo
sum. It can be seen as a diagonal red area, starting at processor
zero.

| David M. Koppelman - koppel@ee.lsu.edu | Modified 9 Jun 2000 10:57 (1557 UTC) |